How to Use Search Console Reports in RightBlogger
See what six views reveal about your traffic, content opportunities, declining pages, and competing URLs, then share or export results.
Reporting turns your Google Search Console data into a live search report for each of your sites. You can check how a site is doing, find posts worth fixing, and share a branded report with a client or sponsor.
This guide covers what each report shows and how to share, export, and customize it. Reporting is different from the SEO Report, which checks a single article against the pages ranking for its keyword.
What You Need
- A paid RightBlogger plan. On the Free plan, Reporting shows an upgrade card instead of your report.
- Google Search Console connected to the project. See How to Connect Google Search Console. If a site is not connected yet, Reporting shows a Connect GSC button that takes you to the project’s settings.
Once Search Console is connected, RightBlogger sets up the report for that site automatically. Each project gets one report.
Open Reporting
Click Reporting in the sidebar. With no site selected, you see All sites: a card for every site with Search Console connected, showing clicks and impressions over the last 28 days. Sites that are not connected are listed underneath. Click a card to open that site’s reports.
To go back to every site, click All sites above the report tabs.
The Report Views
Each site has six views, shown as tabs at the top of the page:
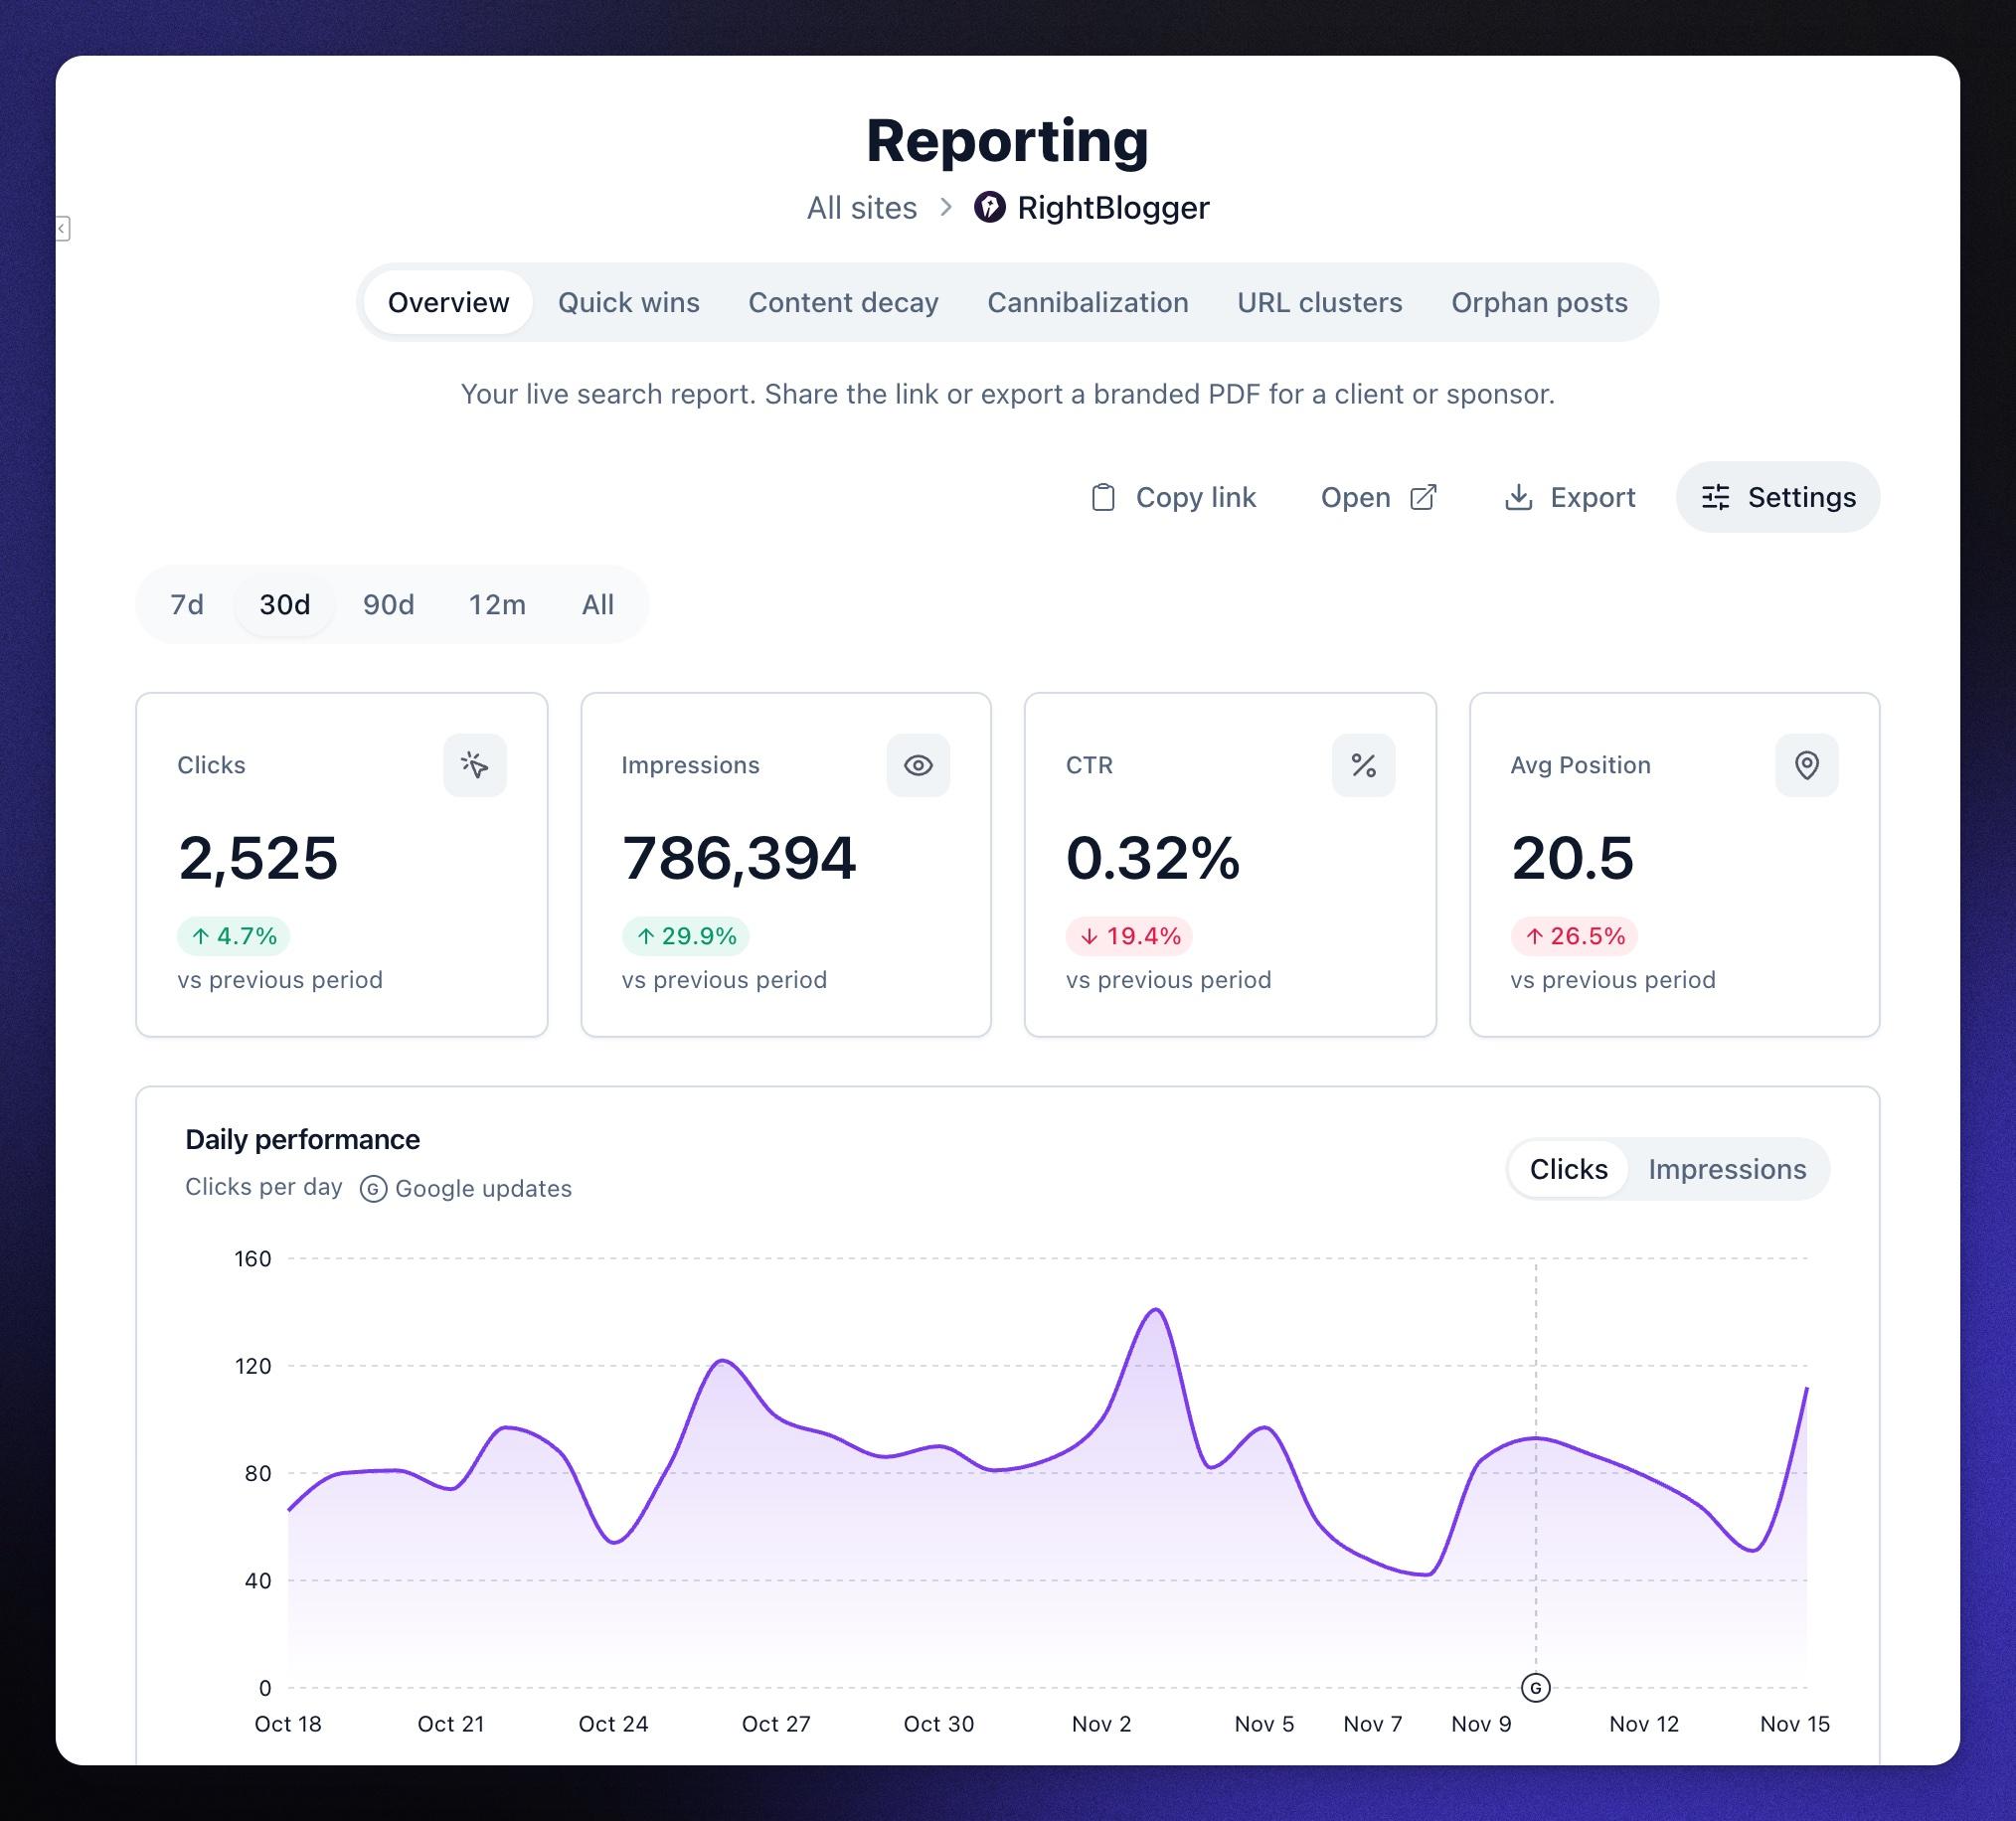
- Overview: your live search report. It shows clicks, impressions, CTR, and average position compared with the previous period, a daily chart you can switch between Clicks and Impressions, then the sections you choose, such as Insights, Top Pages, and Top Queries. This is the report you share.
- Quick wins: searches where you rank between positions 8 and 20, biggest first, each with a suggested next step. A second list, Seen but not clicked, shows pages that get fewer clicks than usual for their position.
- Content decay: pages getting fewer clicks than the same months last year, with the likely reason, such as fewer searches or lost rankings. You can change the months of history, switch between clicks and impressions, and set how big a drop counts. It needs 6 full months of Search Console data.
- Cannibalization: searches where two or more of your pages compete and split the clicks.
- URL clusters: clicks grouped by site section (URL folder), and how much of your traffic comes from pages outside your main sections.
- Orphan posts: posts that no other post links to, with the most impressions first. This view uses your Site Scan, so it fills in once enough of your site has been scanned.
Quick wins, Cannibalization, URL clusters, and Orphan posts look at the last 90 days. Quick wins, Content decay, URL clusters, and Orphan posts each have an Export CSV button.
Where Site Agent can work on your site, rows in Quick wins, Content decay, and Orphan posts have a Fix with agent button. It gives Site Agent a task for that page, such as improving it for a search it nearly ranks for, or adding links to an orphan post.
RightBlogger keeps your Search Console history beyond the 16 months Google stores, so long-range views like Content decay get more accurate over time.
Date Ranges
On the Overview, choose 7d, 30d, 90d, or 12m above the numbers. Once RightBlogger has stored more than 16 months of history for your site, All shows everything it has.
Changing the range here only changes your own view. The range a shared report opens with is set in Settings (see below). Search Console data runs about 3 days behind.
Insights and AI Visibility
Insights is a short plain-English summary of the period, such as how clicks changed, which search and page led, and where there is room to improve. You choose how many insights to show in Settings.
The AI visibility section shows how often AI assistants name your brand in answers to the questions you track, and your share of voice against competitors. It is available when the project has an AI Brand Monitor that has run its checks, and it is off until you turn it on in Settings.
Share the Report
The buttons above the Overview act on the shared report:
- Copy link copies the report’s link. Anyone with the link sees the live report without signing in, and the numbers stay up to date on their own.
- Open opens the report in a new tab, exactly as the people you share it with will see it.
If you would rather serve reports from your own address, like reports.youragency.com, see How to Use a Custom Domain for White-Label Reports.
Export Data or a PDF
Click Export to download your data. The dialog has up to three tabs:
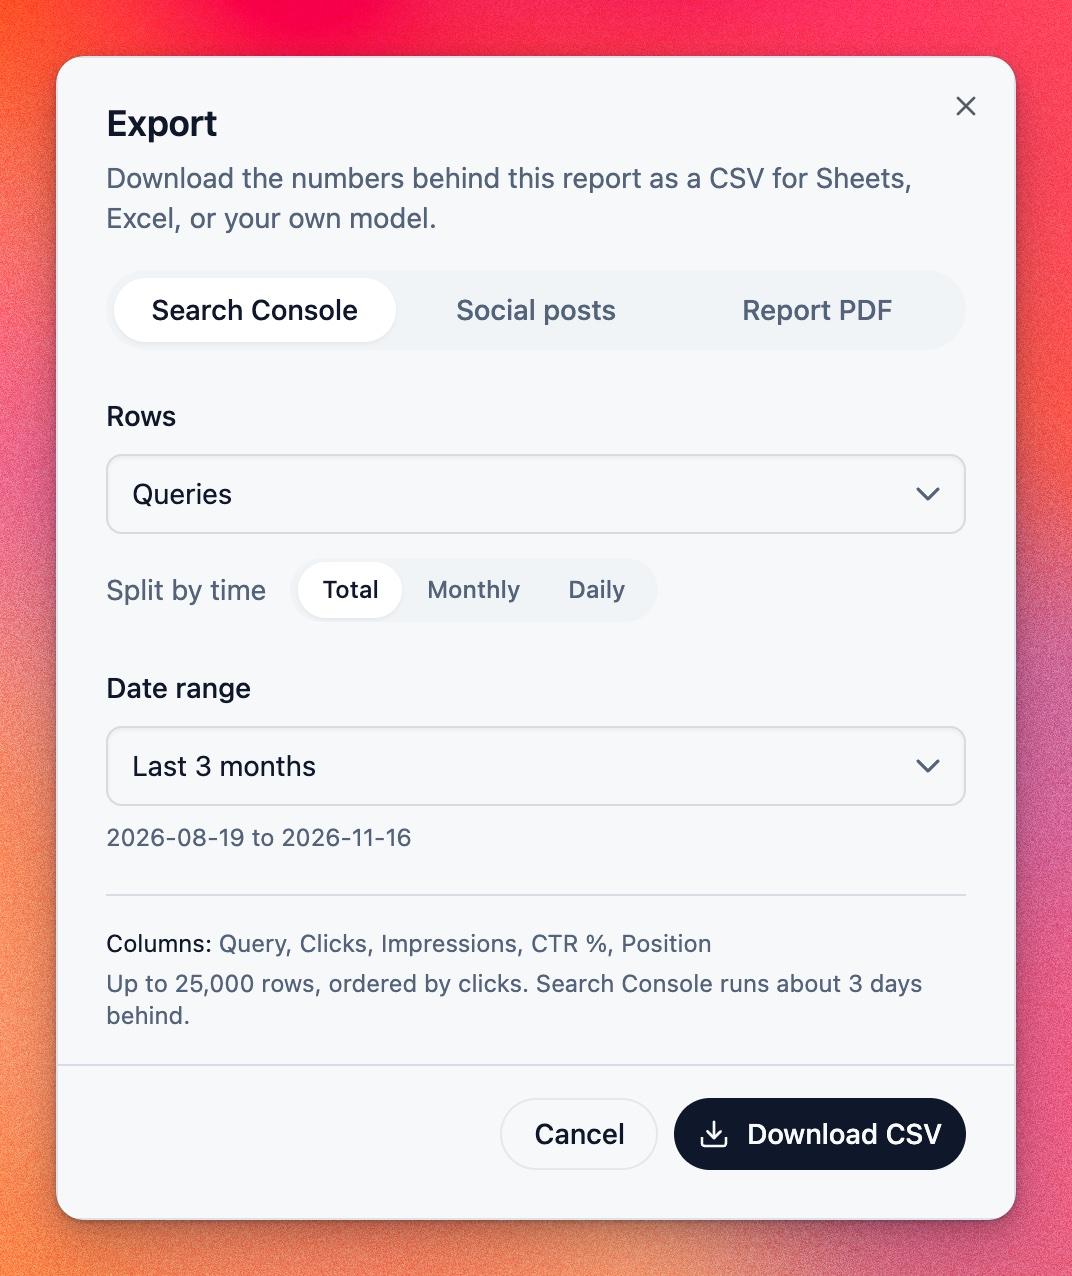
- Search Console: a CSV for Sheets or Excel. Pick the Rows (queries, pages, queries by page, countries, or devices), choose whether to split by time (Total, Monthly, or Daily), and set the Date range. Each export holds up to 25,000 rows, ordered by clicks.
- Social posts: a CSV of your social posts, shown when the project has connected social accounts.
- Report PDF: the report itself as a branded PDF, with every section you have switched on. It takes about a minute to build, and you get a link when it is ready.
Customize the Report
Click Settings to change how the shared report looks and what it includes. Click Save changes at the bottom when you are done.
Branding
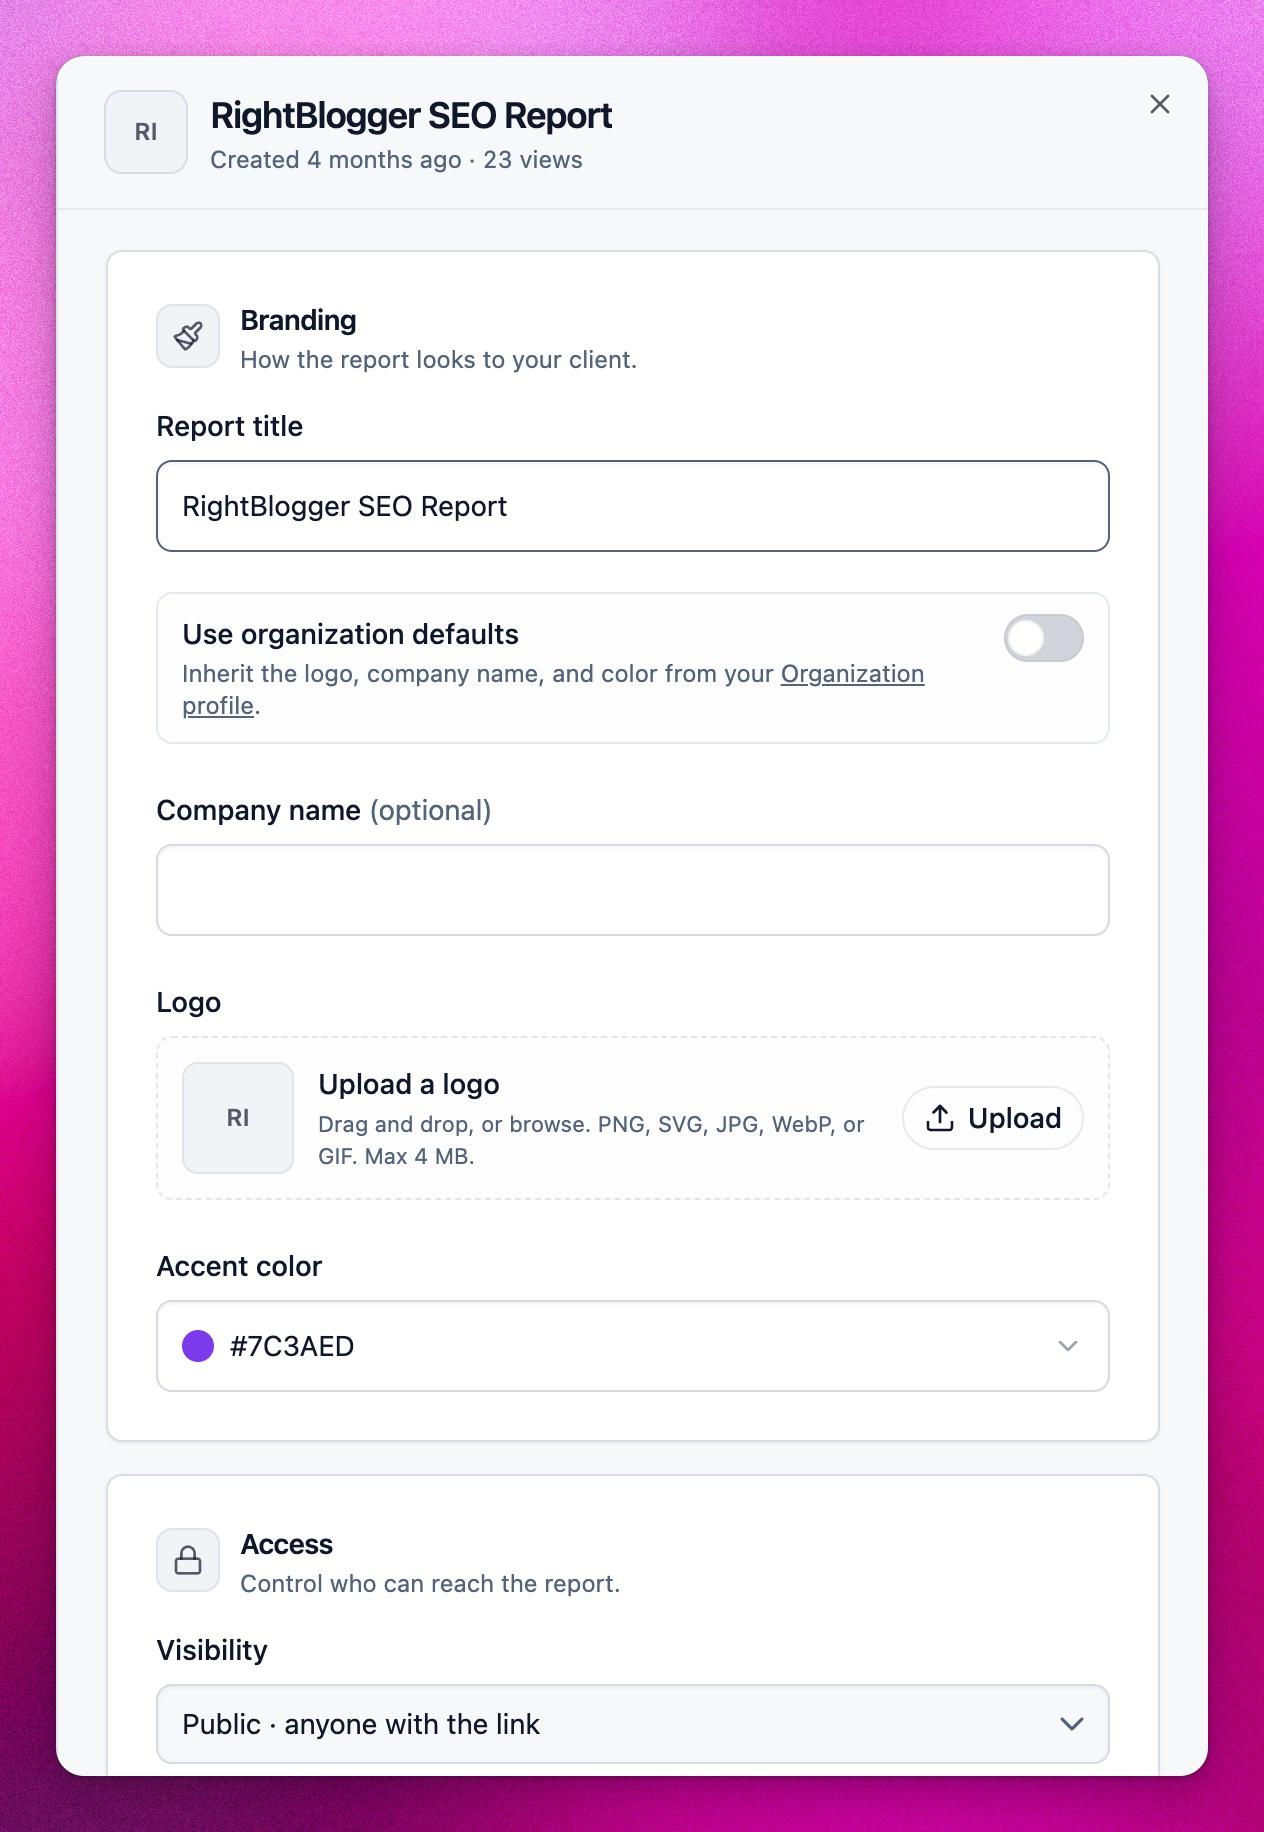
- Report title and Company name.
- Logo: upload a PNG, SVG, JPG, WebP, or GIF up to 4 MB.
- Accent color: the color used for charts and highlights.
- Use organization defaults: use the logo, company name, and color from your Organization profile instead.
Access
- Visibility: Public lets anyone with the link open the report. Private limits it to you.
- Custom domain: covered in its own guide.
Report content
- Date range: the range the shared report opens with (last 7, 30, or 90 days).
- Google updates: marks Google’s core, spam, and reviews updates on the daily chart.
- Section switches for Insights, Top pages, Top queries, Recent posts, Social analytics, AI visibility, Devices, and Countries. Under Top queries, Branded searches splits clicks into branded and non-branded searches.
- Quick wins, Content decay, Keyword cannibalization, Site sections, and Orphan posts can be added to the report as sections too.
- Drag sections by their handle to change the order they appear in.
The header of the Settings panel shows how many people outside your team have opened the report.
Related Guides
Still need help?
Ask the AI assistant for an instant answer, or reach us directly and we will get back to you as soon as we can.
Automated SEO Blog Posts for Your Site
Research, write, publish, and share from one account.
7-day free trial. Cancel anytime.